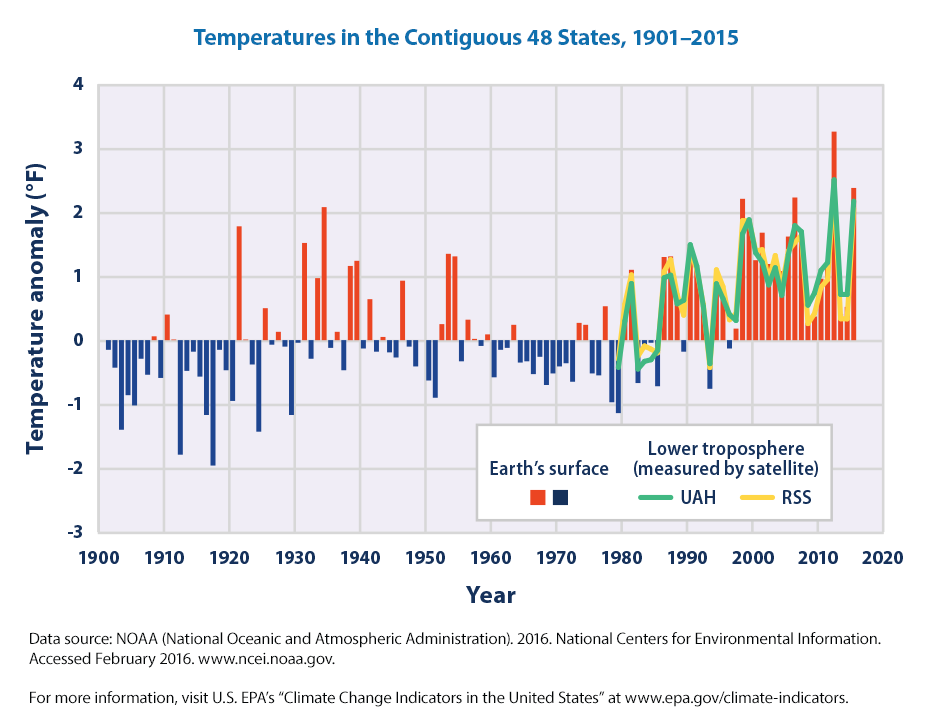
Temperatures are on average increasing across the world. This recent growth in average temperature is referred to as global warming. Global warming has been associated with various types of climatic and environmental change, hence the associated term climate change. According to analyses from NOAA’s temperature records since 1901, the EPA reports that average surface temperature has risen at an average rate of 0.14°F per decade across the contiguous 48 US states. From 1880 to 2020 global average temperature has risen by 1.84° F (1.02° C).
Since the late 1970s average temperatures have risen more quickly, beginning a trend of the warmest years on record in the US, as the graph shows below.
According to NASA, 2020 tied with 2016 as the warmest years on record for global average surface temperature. In a novel and likely impactful study, as of March 2021 NASA confirmed the climate model predictions that human greenhouse gases emissions, and not other natural factors, indeed account for most of the increase in global temperatures from 2003 through 2018.
There is a long list of independent research on this topic including from the Intergovernmental Panel on Climate Change (IPCC). Although the change in degrees may seem small, this research and knowledge about climate suggests they may have strong impacts on human and other life, including with substantial changes to sea level, droughts, floods, heat waves, agriculture, diseases and hurricanes. Globally, it may be a factor for the migration of millions. Although these changes are acknowledged, it is unclear how temperature changes will impact specific towns and regions across the US and the world.
RTP is an open-access and open-source web-based application that facilitates research and understanding of historical temperature changes for particular regions of the US, namely by analysis of county temperatures. The application retrieves data from NOAA's Global Historical Climatology Network (GHCN) data to create a county profile of temperatures from selected county data stations.
RTP presents record and average temperatures for the specific county and specific month of interest selected by the user. It provides analyses of pre- and post-1980 temperatures – given the higher rise in temperatures observed since then. RTP also performs a cluster analysis to identify the low, middle and high clusters of temperatures across the temperature record. Lastly, RTP performs a simple regression analysis to attempt to predict future average temperatures for the particular month of interest and a future year of interest selected by the user. Although model accuracy, as reported by MSE and R2 scores are not often strong we intend to improve these analyses in future implementations.
RAFT and RTP were conceptualized by Nic DePaula, who also guided the development of RTP. The RTP was designed, developed and implemented by Sunayana Sharma, Maximillian Hendricks, Thaddious Gorges, Shubham Tiwari, and James Bradbury as part of their Winter 2021 Computer Science capstone project.